
- 04 Jan 2015
In this week's news story, we report on some statistics from our two online courses that ended in December: Introduction to Complexity and Nonlinear Dynamics. These statistics come from the surveys we ask participants to fill out at the beginning of the class, and from class results to date.
Total enrollments were 4,275 for Introduction to Complexity, and 2,729 for Nonlinear Dynamics.
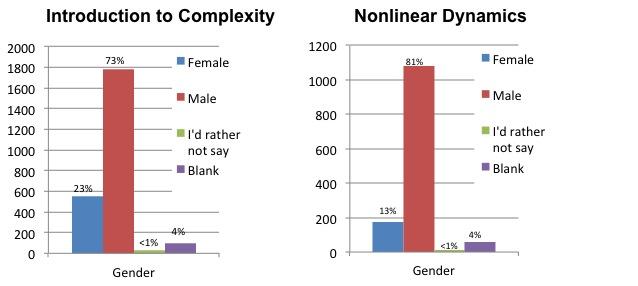
Gender Distribution
The gender distributions for these two courses are given below. These are similar to gender distributions we've seen over the last two years of offering courses.
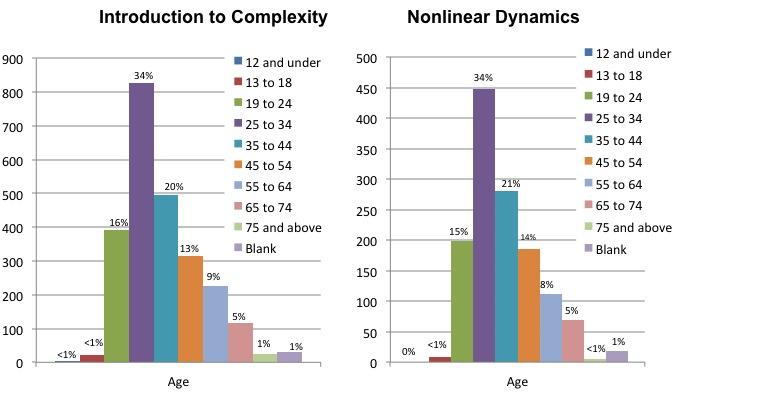
Age Distribution
The age distributions (below) show a fair amount of diversity, though with a strong peak in the 25 to 34 year-old range. This is similar to what we say in our previous MOOC offerings, and what has been reported for MOOCs on other platforms (e.g., Coursera, EdX). Most likely, this reflects the fact that many MOOC participants are graduate students.
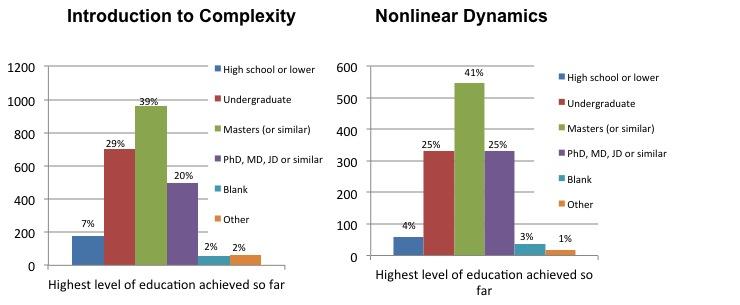
Level of Education
The highest level of education achieved so far also shows some diversity, although it was suprising to us that, even for the Intro course, about 60% of people of people who answered this question had a masters degree or higher.
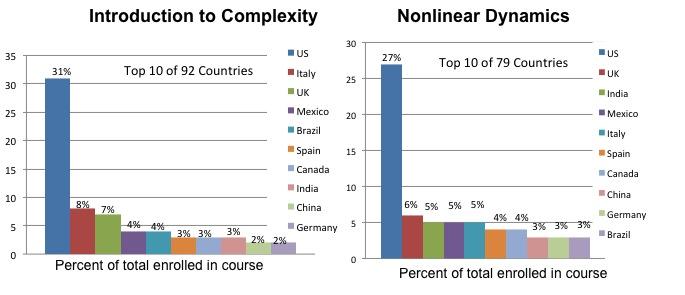
Countries of Enrolled Participants
As common for our MOOCs, enrolled students came from many differerent countries: 92 countries were represented in Introduction to Complexity and 79 were represented in Nonlinear Dynamics. The graphs below show what percent of the total enrollment came from each of the top 10 of these countries.
Successfully Completed Course
A total of 4,275 people enrolled in Introduction to Complexity, of which 427 (~10%) successfully completed all units and earned a certificate. A total of 2,723 people enrolled in Nonlinear Dynamics, of which 305 (~11%) successfully completed all units and earned a certificate.
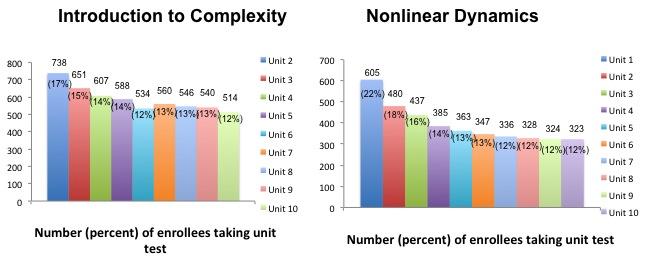
Completion of Course Units
The course completion rates are a bit misleading, since many people enroll in the course just to see what the course is like, and never have the intention to finish. One way to estimate the fraction of enrollees who are actually engaged in the course is to count the number who actually take the end-of-unit tests. We found that for each course, while less than a quarter of the total enrollees took the first test (and thus were at least somewhat engaged in the course), more than half of those who were engaged in this way went on to take all the tests (though a small number of these did not do well enough to receive a certificate). The graphs below summarize this information.
We hope you found these various statistics interesting! We will continue to publish similar statistics for all the courses we offer.